How California's Renewable Energy Actually Performed in 2013
As we close in on the end of the year, it's customary to look back and assess the past. And when it comes to renewable energy in California, the year drawing to a close has been an epochal one. In 2013, California saw abundant installations of a number of different kinds of renewable power plants, from gigantic wind turbines to modest rooftop solar arrays, and lots of changes in the laws that regulate how we generate and use renewable energy.
We've covered many of those records here at ReWire, as recently as this week. But it's important to look at what those records actually mean in context. Record peak output from the state's solar panels and wind turbines may make for an interesting headline. What really matters in the long run, though, is how much renewables contribute to the total energy Californians use.
So ReWire just spent the last several days inputing a year's worth of daily renewable energy numbers provided by the agency that runs the state's power grid, and then crunched those numbers. They provide an interesting snapshot of the actual usefulness to Californians of renewable energy in 2013, and some of what we found out may surprise you.
We got the data from the California Independent System Operator (CaISO), in the form of CaISO's daily reports on renewable energy. Every day, CaISO automatically generates a detailed report on how each of several categories of renewable energy generators contributed to the grid. The generators include solar thermal, "solar" (by which CaISO means non-thermal solar, or photovoltaic panel power), wind, small hydro, biogas, biomass, and geothermal.
Among the stats CaISO publishes each day are the total number of megawatt hours each source of renewable energy pumps into the grid, and that's what we decided to look at. We took each day's figures between November 1, 2012 and November 31, 2013, plunked them into a spreadsheet and did some number crunching.
What we found surprised us.
In the first 11 months of 2013, Californians used 215,014,448 megawatt-hours of power. Or 215 terawatt-hours. That's enough power to run 30 good-sized air conditioners for every person on earth for 30 hours each. If we were to get that much energy by burning coal, it'd take 49 mid-sized coal plants to do it.
In those same 11 months, the renewable sources tracked by CaISO provided 30.6 of those 215 total terawatt hours, a little over 14 percent of the total. Or seven coal plants' worth.
If that seems lower than you'd expect given our state's recent emphasis on renewables, join the club. Despite a veritable orgy of building renewable energy generating capacity over the past year, the proportion of California's total energy consumption provided by renewable energy went up by less than one percentage point in the last 12 months. In December 2012, the seven forms of renewable energy listed above supplied just over 11.13 percent of California's energy consumption. By November 2013, that figure had risen, but only barely: renewables made up 12.08 percent of last month's total energy supply in California.
That's despite a significant increase over those 12 months in the amount of solar energy entering the grid: in November '13, solar thermal and solar fed the grid twice and almost four times the megawatts-hours, respectively, that they did in December '12. But aside from biogas, which burns methane emitted from decomposing organic matter to turn turbines, every other source of renewable energy put less energy into the grid in November 2013 than in December 2012.
The biggest drop was in small hydro, which generated only a little more than half its December 2012 output in November. Wind turbines ran at about 91 percent of their December 2012 output, the second largest deficit.
Of course, there are a lot of months in between December and November, and just comparing the beginning and end months of the last 12 can obscure some important data. For example, few California energy people expect wind to perform well in the winter. Wind is generally at its best between April and September, and as the graph here shows, 2013 was no exception. Click the image for a larger version:

During the spring months, wind power easily outstripped all its renewable colleagues in the amount of power it put into the grid, besting eight percent of total demand in April and May. Actual production only slackened a bit in June, but as wind was going a little slack the state's demand for power was heating up. (That's why wind's percentage of demand for June is lower, even though wind turbines produced a bit more power in June than they did in April.)
As you can see from these graphs for the last few years, the pronounced seasonal pattern in wind production in California isn't restricted to this year. The wind tends to blow in spring and summer around the Golden State, and not so much at other times of the year. The build-out of California wind turbines is making a difference during the windy season: those turbines made about 500 megawatt-hours more in May 2013 than they did in May 2012.
Still, it's notable that California wind's output for last month actually made up less of our state's total power consumption than was the case in December 2012. It may be that November 2013 was unusually calm, with a consequent drop in output, and that next year will be windier. It's worth tracking.
When you compare wind's 2013 output to other forms of renewable energy, those other forms seem to have served us more consistently through the year. Click to see what we mean:

Wind outperformed other sources through the peak consumption months of July through September, then died off fast. By November, wind produced so little power that the geothermal plants became the state's largest source of renewable power.
The truly striking increase over 2013 (so far) came in the state's solar power output. In December 2012, solar power plants supplied less than three quarters of one percent of the state's monthly power consumption. That was up to 2.69 percent last month. That's still a small amount compared to wind's eight and a half percent when the wind blows, but it's a notable increase.

As always, keep in mind that CaISO only tracks solar energy that's hooked up to the grid on the utility-side of the electric meter, which means the power produced by rooftop solar arrays in your neighborhood isn't reflected here. California's solar power production is a lot bigger -- and growing a lot faster -- than this graph reflects.
What do all these different sources of renewable energy look like compared to our total energy use? Here's one more clickable graph:
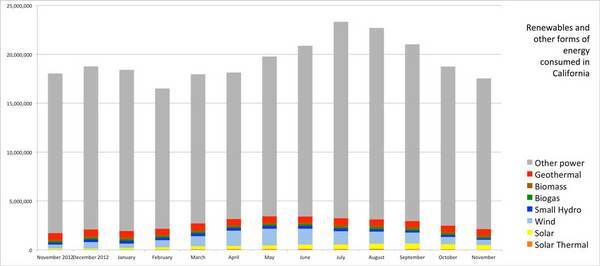
Those ominous gray bars represent all the rest of the power California consumed each month that didn't come from solar, wind, biogas and biomass, geothermal, or small hydro tracked by CaISO. Some of the gray comes from California's one remaining nuclear power plant. Most comes from the state's fossil-fuel-fired thermal generating plants. A significant chunk comes from large hydroelectric plants, which -- despite being technically renewable -- CaISO does not track as a source of renewable energy. (We'll take a closer look at California's large hydro scene as we continue our look at the end of the year.)
And a significant portion of those gray bars is energy imported into the state, which can range from hydro and wind to coal-fired power. So the little renewable energy sections at the bottom of each column in the above graph should actually be somewhat larger. Just how much larger would be hard to say without a lot more digging.
Despite those caveats, one thing's clear: even though we've been building renewable energy generating capacity like a house on fire in the last year, that capacity still makes up a small slice of the power we use 24/7/365.


